Analyze Performance
When performance issues arise, start by determining whether the entire system is affected or only specific components. This distinction will help guide the next steps in identifying and resolving the root cause.
Check Your Infrastructure
If your system runs in the ADITO Cloud, you can request a detailed infrastructure analysis from the ADITO IT team. Based on this assessment, they can recommend and provide the necessary hardware or resource adjustments to resolve detected bottlenecks.
Activate Logging
To analyze the duration of key operations, enable detailed logging for both JDito and database activities.
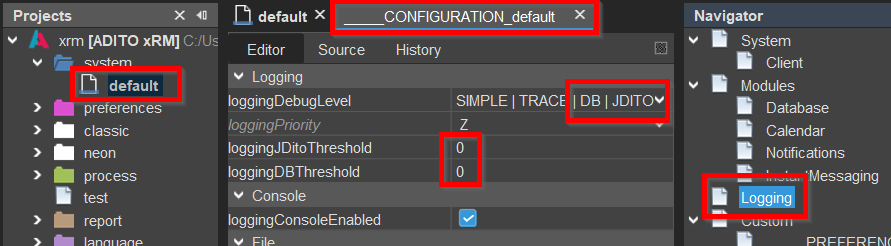
In the ADITO Designer, navigate to the Instance Configuration > Logging section and set the following:
loggingDebugLevel: EnableDBandJDITOby checking the respective boxes.loggingDBThresholdandloggingJDitoThreshold: Set both values to0to log all database queries and JDito processes. This is important to catch operations that individually run quickly but occur very frequently — which can significantly affect overall performance.
Depending on your ADITO version, a restart of the ADITO server may be required for these settings to take effect.
Once enabled, you can inspect the logs either in the ADITO Designer or via the ADITO Manager.

Example of a log entry in the ADITO Manager
Avoid enabling unnecessary logging in production environments. Excessive logging can reduce system performance and clutter log files, making analysis more difficult.
Analyze Duration and Frequency
To get an overview of system performance, simulate typical user interactions in the ADITO client — such as opening views, triggering actions, and navigating through data — while monitoring the logs in parallel.
Focus specifically on:
- Operations that take a long time to execute
- Operations that are triggered very frequently
These patterns help identify performance bottlenecks. For example, if opening a FilterView loads 400 datasets and the log shows a specific process executed 400 times, it likely points to a JDito valueProcess or displayValueProcess being triggered per record.
In such cases, consider replacing the process with a SQL-based expression in the RecordFieldMapping of the RecordContainer. This expression is only evaluated once at load time and can significantly reduce overall execution time.
Analyze Memory Management
Java uses an automatic Garbage Collector (GC) to manage memory by freeing unused objects. Over time, the GC adapts its behavior to optimize for real workload patterns. However, you should regularly monitor heap usage to identify potential inefficiencies or risks of memory exhaustion.
Performance vs. Memory Usage
Memory optimization often competes with performance goals. For example, using entities.getRows inside frequently executed loops:
- Can reduce performance due to repeated data access
- But simplifies GC behavior because small, short-lived objects are easier to reclaim
In contrast, loading large datasets in one step may improve performance but require more heap memory. If not managed well, this could lead to OutOfMemoryError exceptions. Increasing the heap size should always be a last resort.
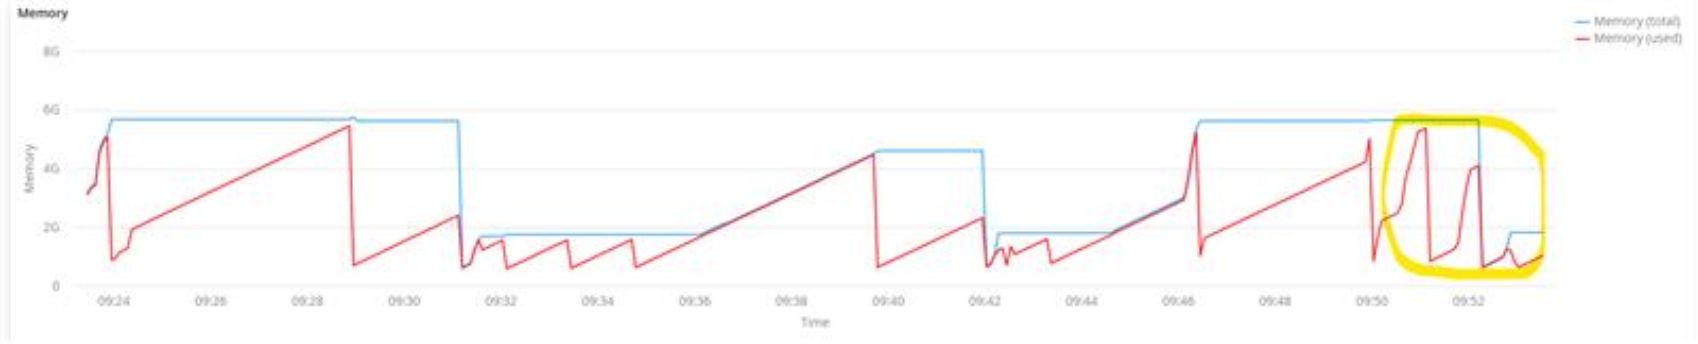
Example: Heap Space Behavior
The chart below shows how the GC adapts after repeated executions of the same task. Initially, memory is only released when the heap limit is reached. After a few cycles, the GC adjusts and begins to collect memory earlier (see yellow circle at the end).
Optimization Recommendations
To improve memory handling in ADITO:
-
Load only required data
- Use
.fields(...)to explicitly select the fields you need. Avoid fetching full entities if not necessary. - Apply
.filter(...)to exclude irrelevant records as early as possible. - Use
.count(...)if you only need the number of records and not their contents.
- Use
-
Avoid repeated loading in loops
- Don’t load data inside frequently executed loops (e.g.,
fororforeach). - Favor a foresighted design: know which fields and records you’ll need before loading.
- Instead, gather all required data in advance and process it in memory.
warningWhen working with large datasets, loading all data in advance can lead to high memory consumption. Even if processing is efficient, the entire dataset must remain in memory until processing is complete — which may exhaust the heap and trigger garbage collection delays or
OutOfMemoryError. Always monitor memory usage and test with realistic data volumes. - Don’t load data inside frequently executed loops (e.g.,
-
Share loaded data across processes
- If multiple processes need the same data, load it once and reuse it via shared or scoped variables.
- Avoid overly broad or monolithic “God objects” — design focused, reusable data holders.
-
Use SQL logic for heavy computation
- Move expensive JDito logic to SQL-based
expressionfields insideRecordFieldMapping. - This enables evaluation at load time instead of per-record, per-process execution.
- Move expensive JDito logic to SQL-based
-
Split complex tasks
- If a process consumes too much memory, divide it into two or more smaller phases.
- This avoids heap pressure and enables faster GC recovery.
-
Minimize process footprint
- Avoid unnecessary object creation or intermediate collections.
- Cache temporary results only when they are reused more than once.
Only increase the server's maximum heap size as a last resort — after you’ve reduced memory pressure through design improvements.
Always validate performance-critical logic with realistic datasets. Measure both runtime and memory consumption under expected load conditions.