Logging
Besides the debugger (see Designer Manual (PDF)), the ADITO server's logging helps you to analyze how your system is running and what errors occur, along with the source of these errors. If the server is running, its log can be displayed via the run config named "Cloud Server - <system name>", which you can find in the combo box below the ADITO Designer's menu bar (maybe you need to scroll down in the combo box, in order to see it):
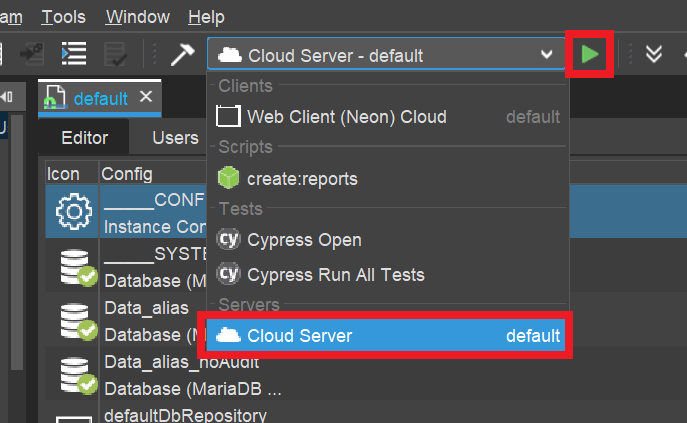
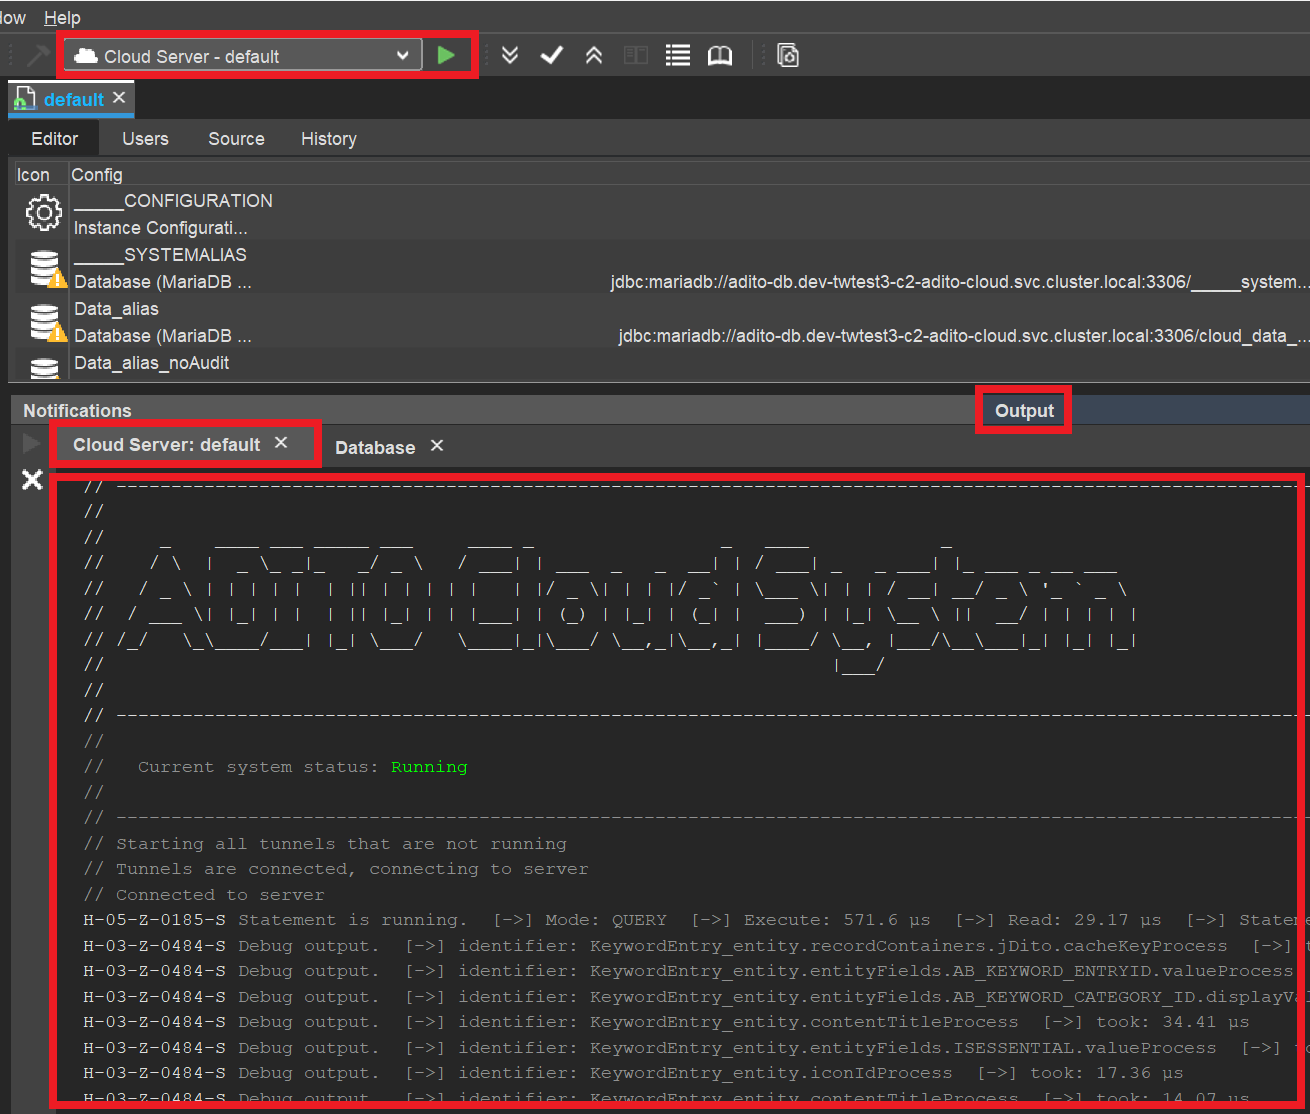
Once you have started this run config, a tab named "Output" will be displayed in the lower middle part of the Designer, which has a sub-tab named "Cloud Server: <system name>". This tab contains the log of the server:
Predefined logging
By default, only errors and a few functions are being logged. Thus, we recommend you to activate the logging for
- database access (to see, e.g., what SQL statements are executed)
- JDito processes (to see, e.g., how often the valueProcess of an EntityField is executed, which can be a hint to performance problems - see AID066 Performance Optimization)
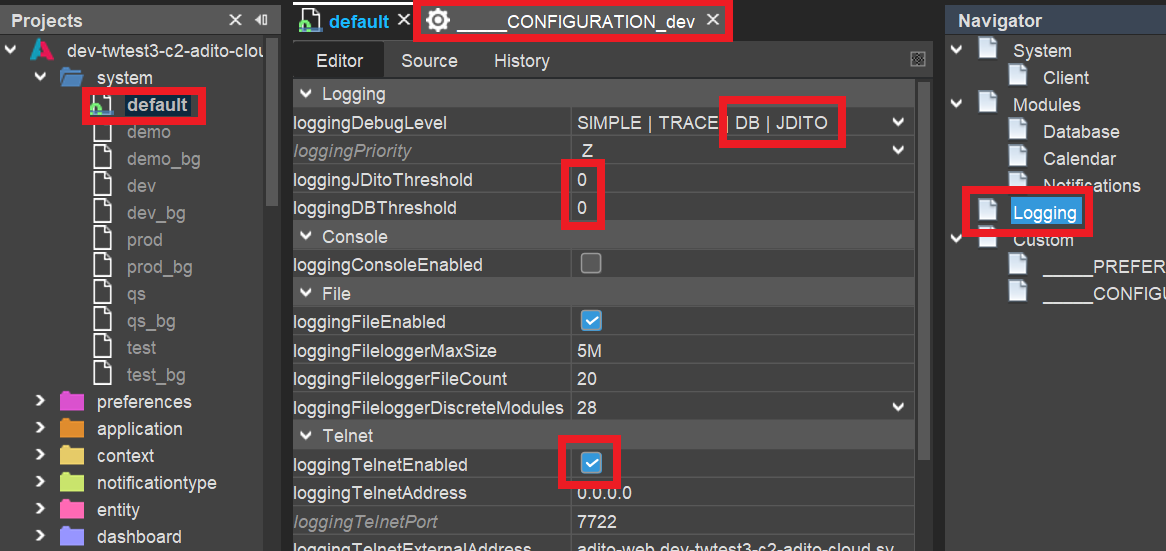
In the instance configuration (see chapter "Instance configuration" of the Customizing Manual (PDF), click on "Logging" (in the Navigator window), which will show the logging properties in the Editor (upper middle part of the Designer). Here,
- open the combo box of property "loggingDebugLevel" and additionally check "DB" and "JDITO"
- set properties "loggingJDitoThreshold" and "loggingDBThreshold" both to "0" (zero milliseconds), meaning that all JDito processes and all database access will be logged, even very short ones.
- make sure that property "loggingTelnetEnabled" is set to true (checked)
You can verify the success by opening any View in the client (e.g., of Context "Company", in menu group "Contact Management") and watching if the server log (in Window "Output") shows log entries for every SELECT statement and for every JDito process being executed.
If you encounter problems, you may find a solution in chapter "Troubleshooting".
Customized logging
You can add further log entries to the server log, according to your requirements, by using methods of module logging. Simple example:
import { logging } from "@aditosoftware/jdito-types";

logging.log("This is the text to be logged.");
The JSDoc of these methods shows what additional parameters you can pass - e.g., to specifiy a certain log level. Furthermore, there are other logging methods available, e.g. logging.logCustom or logging.debug, which have further parameters that help you to optimize the log message. Find more information via the autocompletion of logging. or via menu Help > Show Documentation (requires plugin "Help" to be installed).
If you want to log an object, you will get the best overview of it, if you use the JSON library to "stringify" it first:
While JSON.stringify(object) returns the object's content in one long line, you get a better result, if you set the parameters as follows
JSON.stringify(object, null, " ")
-> Result (example):
{
 "entity": "Person_entity",
 "object": {
  "PERSON_ID": "0a611832-9476-481e-bde5-af3c3a98f1b4",
  "CONTACTID": "a8a5f214-8165-4627-bee2-bceb3578147e",
  "FIRSTNAME": "John",
  "LASTNAME": "Smith"
  }
}
test
Logging in "catch" section
In practice, logging is often used in the catch section of try...catch.
Here, a common mistake is to simply output the error itself:
try
{
    ()...)
}
catch(err)
{
    logging.log(err);
}
Often, this shows only a long stacktrace that is hard to analyze.
Instead, the log should include further information that helps to identify the problem.
Example from contentProcess of Duplicate_entity (module duplicate):
    try
    {
        duplicates = duplicates.concat((new DuplicateUtils(pMappingObj)).execute());
    }
    catch (e)
    {
        logging.log(e, logging.ERROR, [
            "error while trying to load duplicates for " + vars.getString("$sys.currentcontextname") + " for user " + vars.get("$sys.user"),
            "Duplicate_entity.jdito.contentProcess()",
            e["rhinoException"] ? e["rhinoException"].toString() : (e.name + ": " + e.message + " " + e.stack)]);
    }
Debugging vs. temporary logging
Besides permanent logging (e.g., to log errors in the catch section, see above), temporary logging is sometimes used in the development process. This raises the question when to use temporary logging and when to use the ADITO Designer's built-in debugger. Generally, the debugger provides you with a lot of options that go beyond pure logging, e.g., you can
- quickly inspect the values of all variables being valid at a specific code line,
- dynamically step from code line to code line, in order to watch the variables' values change
- execute functions
- define conditions when to halt at certain code lines
- manipulate variables by setting certain values
- and many more (see the chapter "Debugger" in the Designer Manual (PDF)).
Therefore, the debugger should be the instrument of your choice in most cases. On the other hand, activating the debugger takes some time and decreases the system's performance - thus, e.g., if you only want to quickly inspect the value of a specific variable, adding a simple temporary logging might be preferred:
logging.log("The value of myVariable at code line 173 is " + myVariable)
Of course, you can also combine this with a condition:
if (myVariable > 100) {
  logging.log("myVariable exceeds 100! Its value is " + myVariable);
}
Nevertheless, a common mistake is to overload your code with temporary log entries and later forgetting to remove them again. At least, you should add an inline comment that marks the logging as temporary:
// TODO remove again
logging.log("My temporary logging text.");
In order to see the log of your cloud server in the Designer's window "Output",
-
set the system property "loggingTelnetEnabled" to true (system > default > ____CONFIGURATION > Logging > Telnet)
-
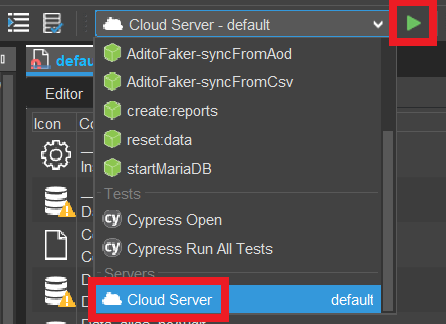
choose "Cloud Server - <system name>" (e.g., "Cloud Server - default") from the combobox in middle of the Designer's button bar and press the green "triangle" button to the right of it.
After a few seconds, you can read the confirmation "Connected to server" in a sub-window of the Designer's window "Output", e.g., entitled "Cloud Server: default". In this sub-window, all further log entries will appear.
Besides this customized logging, all JDito processes and database access (SQL statements) can be logged, if you activate the corresponding log level via the system preferences:
Navigate to system > default > ____CONFIGURATION > Logging > Logging > loggingDebugLevel: Here, then check "DB" or "JDITO", respectively, and save your changes.
After a few seconds you should see various log entries in the output window, when working with your client. (Due to a bug, the logger might automatically be connected with the wrong web server pod and thus show no output. In this case, as a workaround, close and re-open the tunnels again and again, until it works. There will be a replacement for this workaround in future ADITO versions.)