SingleDataChart
The SingleDataChart ViewTemplate provides a chart-based representation of single-dimensional data derived from a specific Entity in the ADITO platform. It allows visualization using various chart types and supports nested data drill-downs.
Overview
This ViewTemplate is designed to display data where each x-axis entry maps to a single y-axis value. It is suitable for representations like pie or funnel charts. The data source is typically defined by specific fields within a dedicated Entity.
Example usage
The ViewTemplate "SingleDataChart" is used in the CampaignCostChart_view. Within the ADITO client, it appears under Marketing > Campaign, specifically in the CampaignMain_view on the "Overview" tab (CampaignOverview_view), positioned below the Gantt chart. It displays a donut chart of fixed and variable costs.
Configuration
To define a chart using the SingleDataChart ViewTemplate, various EntityFields must be specified in the associated properties. In our example, these are:
| Property | Assigned Field |
|---|---|
xAxis | X |
yAxis | Y |
parentField | PARENT |
entityField | #ENTITY |
chartType | DONUT |
Functional Description
The SingleDataChart and MultiDataChart ViewTemplates operate on similar principles. Both retrieve data typically through a JDitoRecordContainer. The key differences are:
- The range of supported chart types differs between the two templates.
MultiDataChartincludes an additional configuration property.
Characteristics of Single-Dimensional Data
The chart displays one value per x-axis entry. This is typical for pie or funnel visualizations where each chart segment represents a singular quantity or value.
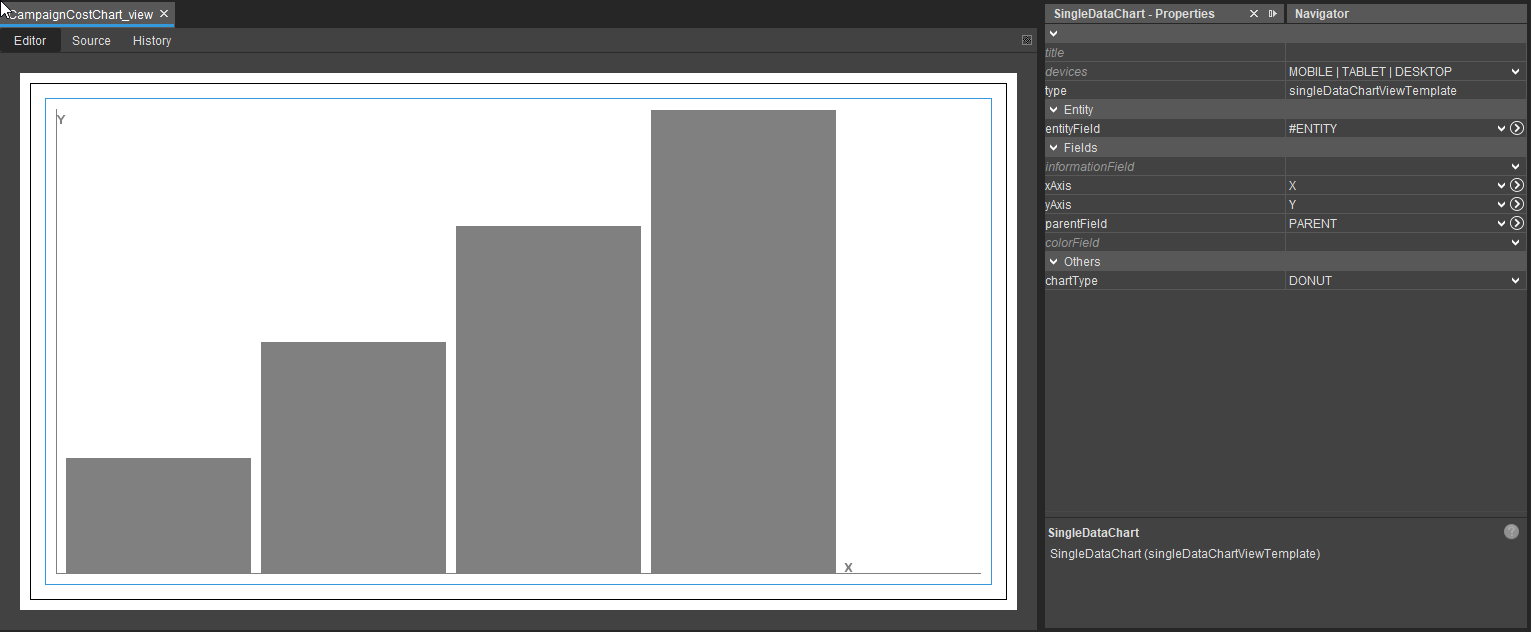
Figure: Sample view of a SingleDataChart
Configuration Properties
General Properties
title: Specifies the chart title.devices: Determines availability on different device types.type: System-defined; identifies the ViewTemplate type.entityField: Entity source for the chart data; typically#ENTITY.informationField: Contains labels to be shown in the chart.
Axis and Structure
xAxis: Determines the categorical dimension (e.g., chart segments).yAxis: Represents the value dimension per segment.parentField: Enables drill-downs by linking entries to parent values.
Color Configuration
-
colorField: Optional field for color coding, based onneon.JDito constants.noteThe colors used depend on the active UI theme. Typically, this field is filled via a
valueProcess.Example valueProcess:
result.string(neon.USER_COLOR_1);
Additional Properties
showDataLabelValues: Specifies if the data labels of the chart should show the actual numeric values.dataLabelPositionInside: Specifies if the data labels should be shown inside the data points. Currently not supported in pie / donut charts.
Chart Type Selection
Supported chart types for SingleDataChart:
- Donut
- Funnel
- Pie
- Pyramid
Implementation Example
The following example demonstrates a pie chart illustrating the distribution of contacts by type, with an optional drill-down to show gender distribution within the "person" contact categories.
Step 1: Setup
- Create a test context.
- Add a View containing the SingleDataChart ViewTemplate.
- Set the chartType property to PIE.
Step 2: Entity Definition
Create an Entity with a JDitoRecordContainer and five fields:
- UID
- X
- Y
- INFORMATION
- PARENTID
Configure the JDitoRecordContainer as follows:
- jDitoRecordAlias: Your defined data alias
- recordFieldMappings:
- UID.value
- X.value
- Y.value
- INFORMATION.value
- PARENTID.value
- contentProcess:
// First step: Gathering all required data
var countOrg = new SqlBuilder().selectCount()
            .from("CONTACT")
            .where("CONTACT.PERSON_ID is null")
            .cell();

var countPrivate = new SqlBuilder().selectCount()
            .from("CONTACT")
            .where("CONTACT.PERSON_ID is not null and CONTACT.ORGANISATION_ID = '0'")
            .cell();

var countFunction = new SqlBuilder().selectCount()
            .from("CONTACT")
            .where("CONTACT.PERSON_ID is not null and CONTACT.ORGANISATION_ID is not null")
            .cell();

// gathering the data for the drill downs
var genderDistPrivate = newSelect("GENDER, count(*)")
                            .from("PERSON")
                            .join("CONTACT", "PERSON.PERSONID = CONTACT.PERSON_ID")
                            .where("CONTACT.ORGANISATION_ID = '0'")
                            .groupBy("GENDER")
                            .table();

var genderDistFunction = newSelect("GENDER, count(*)")
                            .from("PERSON")
                            .join("CONTACT", "PERSON.PERSONID = CONTACT.PERSON_ID")
                            .where("CONTACT.ORGANISATION_ID is not null and CONTACT.PERSON_ID is not null")
                            .groupBy("GENDER")
                            .table();

// Second step: Building our graph data
var ret = [];

// Main chart data
ret.push([util.getNewUUID(), "ORG", countOrg, "Organisations", null]);
ret.push([util.getNewUUID(), "PRIVATE", countPrivate, "Organisations", null]);
ret.push([util.getNewUUID(), "FUNCTION", countFunction, "Organisations", null]);

// Drill down for PRIVATE
for(let i = 0; i < genderDistPrivate.length; i++)
    ret.push([
        util.getNewUUID(),
        genderDistPrivate[i][0],
        genderDistPrivate[i][1],
        KeywordUtils.getViewValue($KeywordRegistry.personGender(), genderDistPrivate[i][0]),
        ret[1][0] // parent ID for "PRIVATE"
    ]);

// Drill down for FUNCTION
for(let i = 0; i < genderDistFunction.length; i++)
    ret.push([
        util.getNewUUID(),
        genderDistFunction[i][0],
        genderDistFunction[i][1],
        KeywordUtils.getViewValue($KeywordRegistry.personGender(), genderDistFunction[i][0]),
        ret[2][0] // parent ID for "FUNCTION"
    ]);

// Final result
result.object(ret);
Ensure parent records are added to the result list before their child entries. Otherwise, drill-down relations will not be correctly resolved.
Step 3: Final Integration
- Assign the created entity to the context.
- Use the View with the configured ViewTemplate across all standard views.
- Register the context under application > ____SYSTEM_APPLICATION_NEON to enable it in the client.
Visual Output
Main Pie Chart
The result displays a pie chart grouping contacts into "ORG", "PRIVATE", and "FUNCTION":
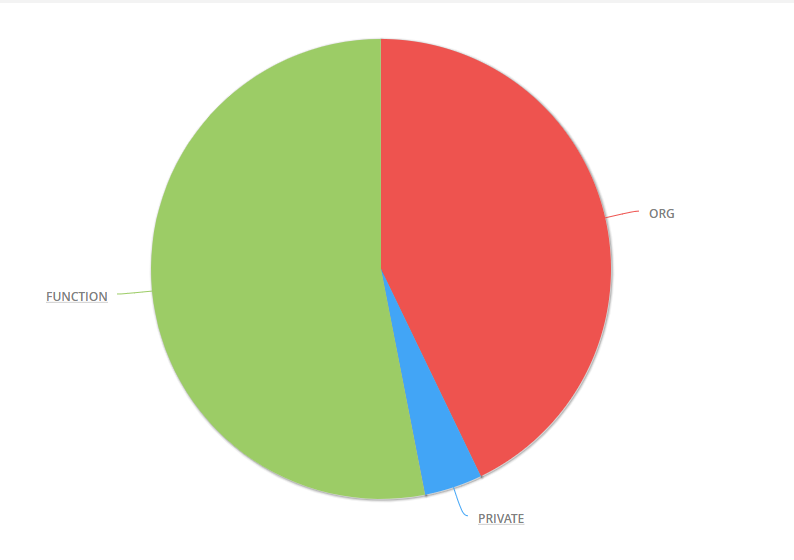
Figure: Contact distribution by type
Drill Down on “FUNCTION”
Clicking on the "FUNCTION" slice reveals gender breakdown:
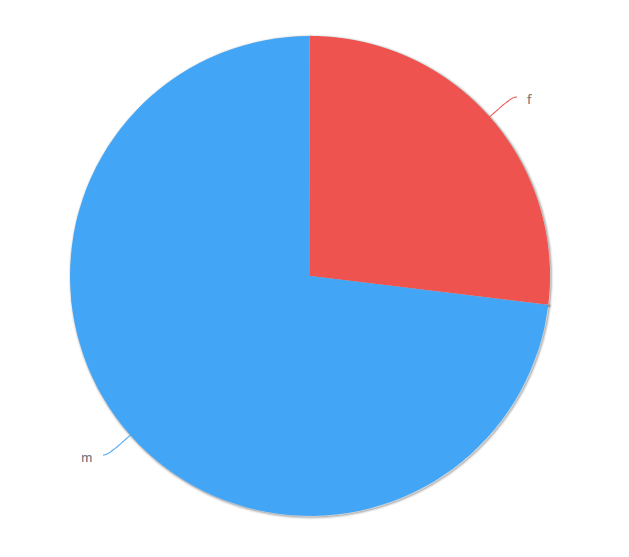
Figure: Gender distribution within functional contacts
As an exercise, extend this implementation by adding a drill-down for "ORG". For example, show how the organisations are distributed by their legal form.