MultiDataChart
MultiDataChart – Displaying Multi-Dimensional Data in Charts
The MultiDataChart ViewTemplate allows you to display multi-dimensional data from a specific Entity using various chart types. It enables visualization of multiple Y values for each X value by assigning categories, and supports drill-down functionality for hierarchical data.
Before working with MultiDataChart, it is recommended to read the chapter SingleDataChart to understand the basic principles.
Overview
The chart visualizes data defined by EntityFields within a selected Entity. The type of chart is configured via the chartType property, which supports various chart formats, such as "COLUMN" or "BAR".
Example
An example implementation of MultiDataChart is provided by the ViewTemplate in CampaignParticipantChart_view.
Client Appearance
In the ADITO client, the chart appears under:
Marketing > Campaign > CampaignMain_view > Tab "Overview" (CampaignOverview_view)
The chart shows, as bars, the number of current and maximum participants (first dimension), separated by added participants and those contacted via telephone (second dimension, via categories).
Configuration
The following properties are defined in the ViewTemplate:
xAxis:XyAxis:YcategoryField:CATEGORYentityField:#ENTITYchartType:BAR
These refer to fields of the CampaignParticipantChart_entity (module campaign).
Advanced Description
While SingleDataChart and MultiDataChart follow the same basic principles and typically retrieve data using a JDitoRecordContainer, MultiDataChart includes an additional configuration option: categoryField. This allows grouping multiple Y values under one X value.
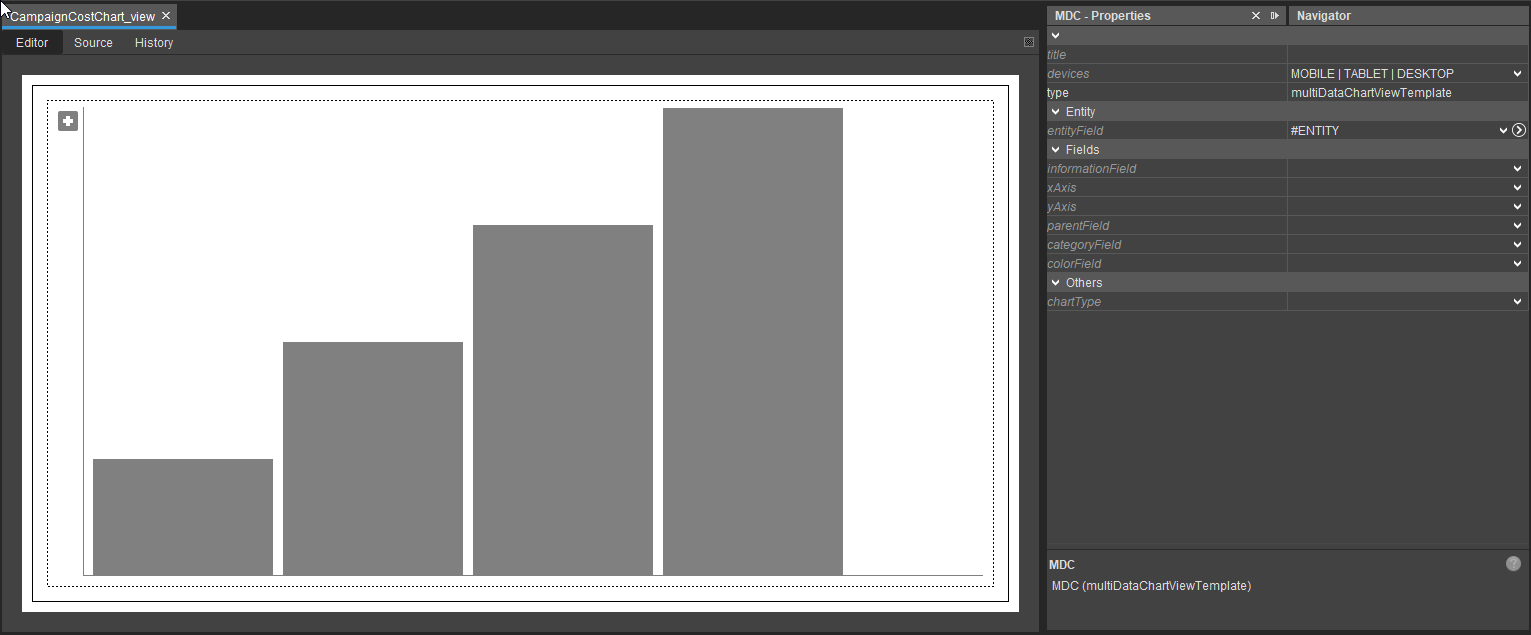
Figure: A MultiDataChart embedded in a View
The MultiDataChart is displayed as an XY chart. It is possible to display more than one Y value for each X value, hence the name MultiDataChart. Additionally, it allows drill-downs by configuring the parentField property.
Properties
The following properties are available in the MultiDataChart ViewTemplate:
| Property | Description |
|---|---|
title | The title of the chart. |
devices | Defines the device types where the ViewTemplate is available. |
type | Set by the Designer to identify the ViewTemplate type. |
entityField | EntityField providing the data, usually #ENTITY. |
informationField | Field containing label information for the chart elements. |
xAxis | Field used as the X-axis. |
yAxis | Field used as the Y-axis. |
parentField | Optional field for drill-down functionality using hierarchical data. For example, if you use a line chart to implement a burndown chart, you might implement a drilldown to present the burndown of each day. |
categoryField | Field representing the category, enabling multiple Y values per X. For example, if the X axis means the number of days, you could display planned vs. actual values as Y values. |
colorField | Field specifying color values. Must return predefined constants from the neon. JDito module. |
chartType | Defines the chart type. Available options: Area, Bar, Column, Spline, Line. |
showDataLabelValues | Specifies if the data labels of the chart should show the actual numeric values. |
dataLabelPositionInside | Specifies if the data labels should be shown inside the data points. Currently not supported in pie / donut charts. |
Color Assignment Example
A typical valueProcess for the colorField may look as follows:
result.string(neon.USER_COLOR_1);
Figure: Assigning a predefined chart color using a valueProcess
The actual color rendered in the client depends on the active theme configuration.
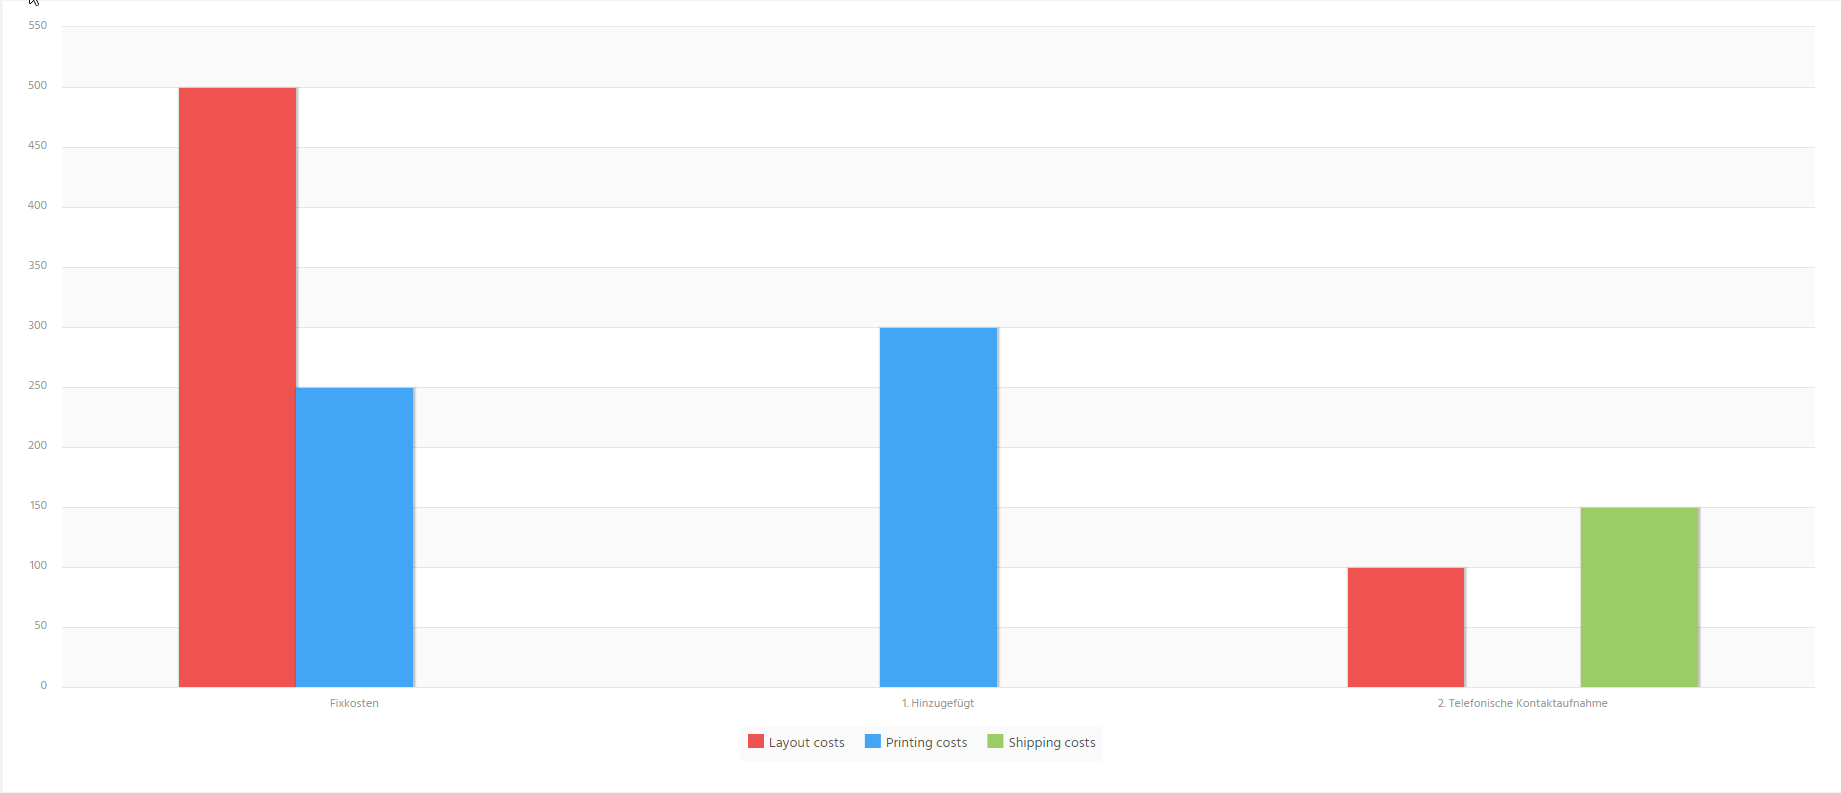
Example Implementation – Campaign Step Costs
This example demonstrates how to create a column chart visualizing fixed and step-specific campaign costs.
Preparation Steps
-
Create a test Context and Entity.
-
Add a JDitoRecordContainer to serve as the data provider.
-
Define and map the required EntityFields: UID, X, Y, CATEGORY, INFORMATION
-
Create a View using the MultiDataChart ViewTemplate.
-
Set the ViewTemplate's chartType to "COLUMN".
-
Insert the following contentProcess into the RecordContainer.
In this example, no drill-down is implemented. The parentField is not used. For drill-down support, refer to the SingleDataChart chapter.
// We use an ID of a campaign of the xRM project's demo data.
// Instead, you could read a Parameter that is passed by a Consumer.
// But for simplicity's sake, we use a fixed id for now.
// If this ID is no longer present, just use another ID
// of a campaign of the demo data.

var campaignId = "680de39f-7f1c-4dca-8c67-9c16c3395c3f";

// initialize required variables
var costData = [];
var ret = [];
var catKeyword = $KeywordRegistry.campaignStepCostCategory();

// gathering data from CAMPAIGNCOST and CAMPAIGNSTEP
costData = newSelect("NAME, CATEGORY, NET, SORTING")
            .from("CAMPAIGNCOST")
            .leftJoin("CAMPAIGNSTEP on CAMPAIGNSTEP.CAMPAIGNSTEPID = CAMPAIGNCOST.CAMPAIGNSTEP_ID")
            .where("CAMPAIGNCOST.CAMPAIGN_ID", campaignId)
            .orderBy("CAMPAIGNSTEP_ID desc, SORTING")
            .table();

// calculate/get display values for our data and
// adding it to our result set
costData.forEach(function([pStepId, pCategory, pNet, pSort])
{
    // if there's no step id, the costs are the
    // fixed costs of the campaign
    if(!pStepId)
    {
        // Set "FixedCosts" as pseudo step id
        pStepId = "FixedCosts";
    }
    else
        // build the step id from the SORTING and NAME columns otherwise
        pStepId = pSort + ". " + pStepId;

    // getting the display value for the cost categories
    // from the keyword
    pCategory = KeywordUtils.getViewValue(catKeyword, pCategory);

    // Add the data to the final result in this order:
    // UID, X, Y, CATEGORY, INFORMATION
    ret.push([util.getNewUUID(), pStepId, parseFloat(pNet), pCategory, pCategory]);
});

// returning the data
result.object(ret);
Figure: contentProcess that prepares multi-category cost data for visualization
Client Result
after adding the Context to your client's Global Menu (application > _____SYSTEM_APPLICATION_NEON) the MultiDataChart will render a column chart with grouped cost data per campaign step, including fixed costs.