DynamicSingleDataChart
The DynamicSingleDataChart ViewTemplate provides a simplified way to display single-dimensional chart data within the ADITO client. Compared to SingleDataChart, it requires fewer configuration steps while still supporting common chart types such as funnel, pie, and pyramid diagrams. The chart is dynamically adjustable by the end user.
Overview
The primary function of this ViewTemplate is to visualize grouped, one-dimensional data based on a minimal configuration. The developer only needs to define the EntityField and the corresponding AggregateField. All other interactions, such as group selection and y-axis selection, are performed by the user at runtime.
Example ViewTemplates
PhaseFunnelChartPhasePieChartPhasePyramidChart
These are used within the SalesprojectAnalysesPhases_view.
Appearance in the Client
The ViewTemplate is, e.g., embedded as a Dashlet in the Sales Dashboard:
- Path:
Sales > Sales Dashboard > Dashlet "Opportunity phase" - Default Position: Lower middle section of the dashboard
- Interactive Controls:
- Users can switch between chart types using the control button in the upper right corner of the Dashlet.
- Available chart variants: Funnel, Pie chart, and Pyramid.
Each chart visualizes data grouped by sales project phases, such as:
- Contact
- Qualification
- Offer
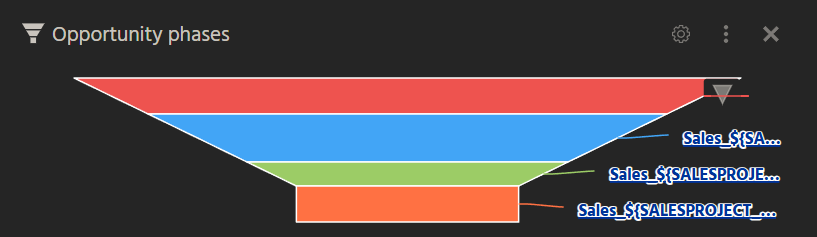
Figure: DynamicSingleDataChart in the Sales Dashboard
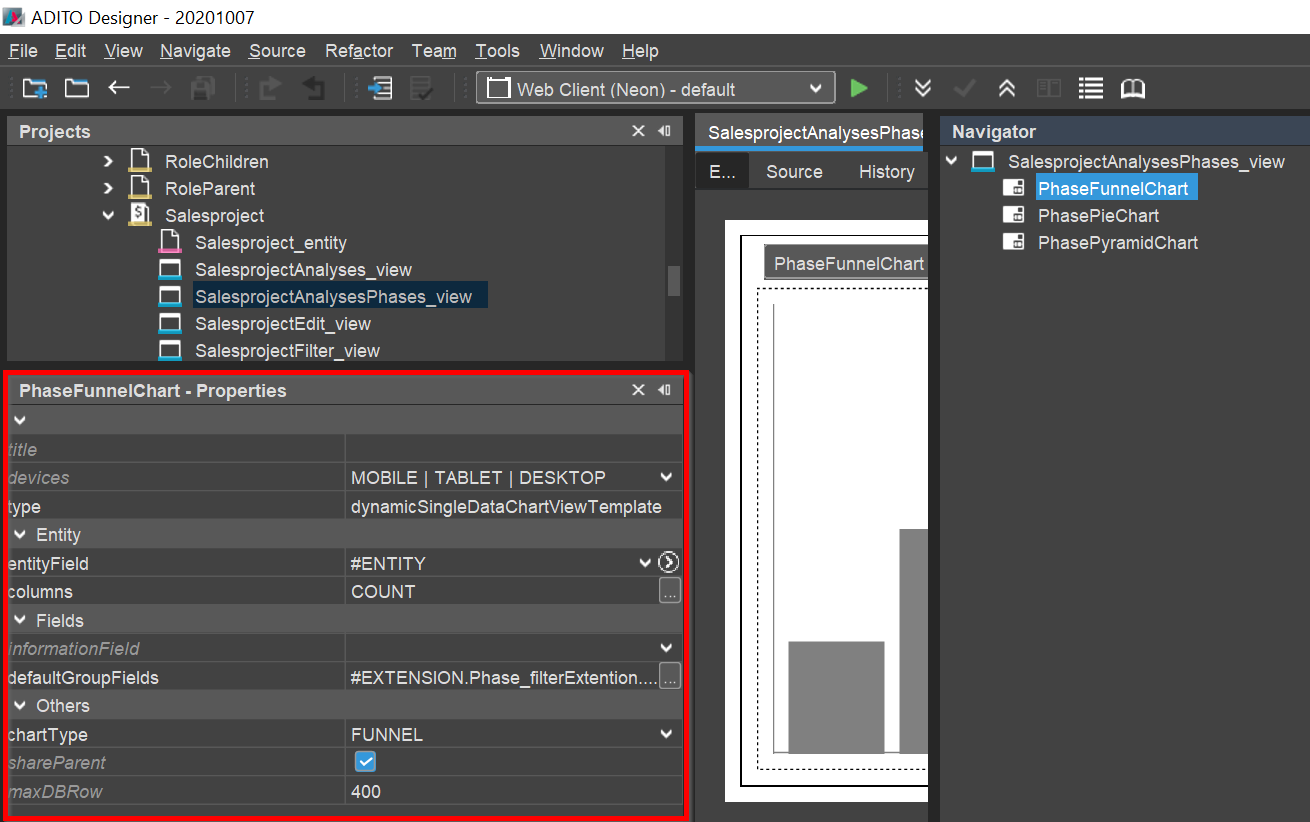
Figure: Configuration fo DynamicSingleDataChart
Configuration
The configuration of this ViewTemplate is intentionally minimal to enhance flexibility:
Required Properties
| Property | Description |
|---|---|
entityField | Defines the dataset source. This field represents the base entity used for chart generation. |
aggregateField | Specifies the value to be aggregated (e.g., count, sum) along the y-axis. This may be a numerical field, such as the number of opportunities in each sales phase. |
The ViewTemplate dynamically generates chart data at runtime based on these fields. Users can then manipulate groupings or switch visual styles without requiring additional backend configuration.
This ViewTemplate is particularly well-suited for use in Dashlets or analysis dashboards where business users benefit from simplified chart creation without technical configuration.