DynamicMultiDataChart
The DynamicMultiDataChart ViewTemplate enables the visualization of multi-dimensional data using a simplified configuration model. Functionally similar to the MultiDataChart ViewTemplate, it allows client-side grouping and aggregation, empowering users to generate and modify analytical charts directly within the ADITO client.
Overview
This ViewTemplate is designed for charts where multiple grouped values are visualized simultaneously — such as grouped column charts — based on two or more data dimensions. Unlike the MultiDataChart, this variant requires only the specification of an EntityField and an AggregateField. All grouping logic and chart-type selection are performed interactively by the end user.
Example
The ViewTemplate "DynamicMultiDataChartProb" is used within the OfferFilter_view.
Appearance in the Client
The DynamicMultiDataChart is typically used as a chart option within a FilterView. In the above example:
- Path:
Sales > Offer > Probability Chart - Access: Select
"Probability Chart"from the dropdown menu of the button related to theGroupLayoutof theFilterView. - Chart Contents:
The chart displays a series of labeled columns such as:- "Checked"
- "Open"
- "Sent"
Each column represents a group (e.g., offer status) and its corresponding aggregated metric (e.g., number of offers or total offer value).
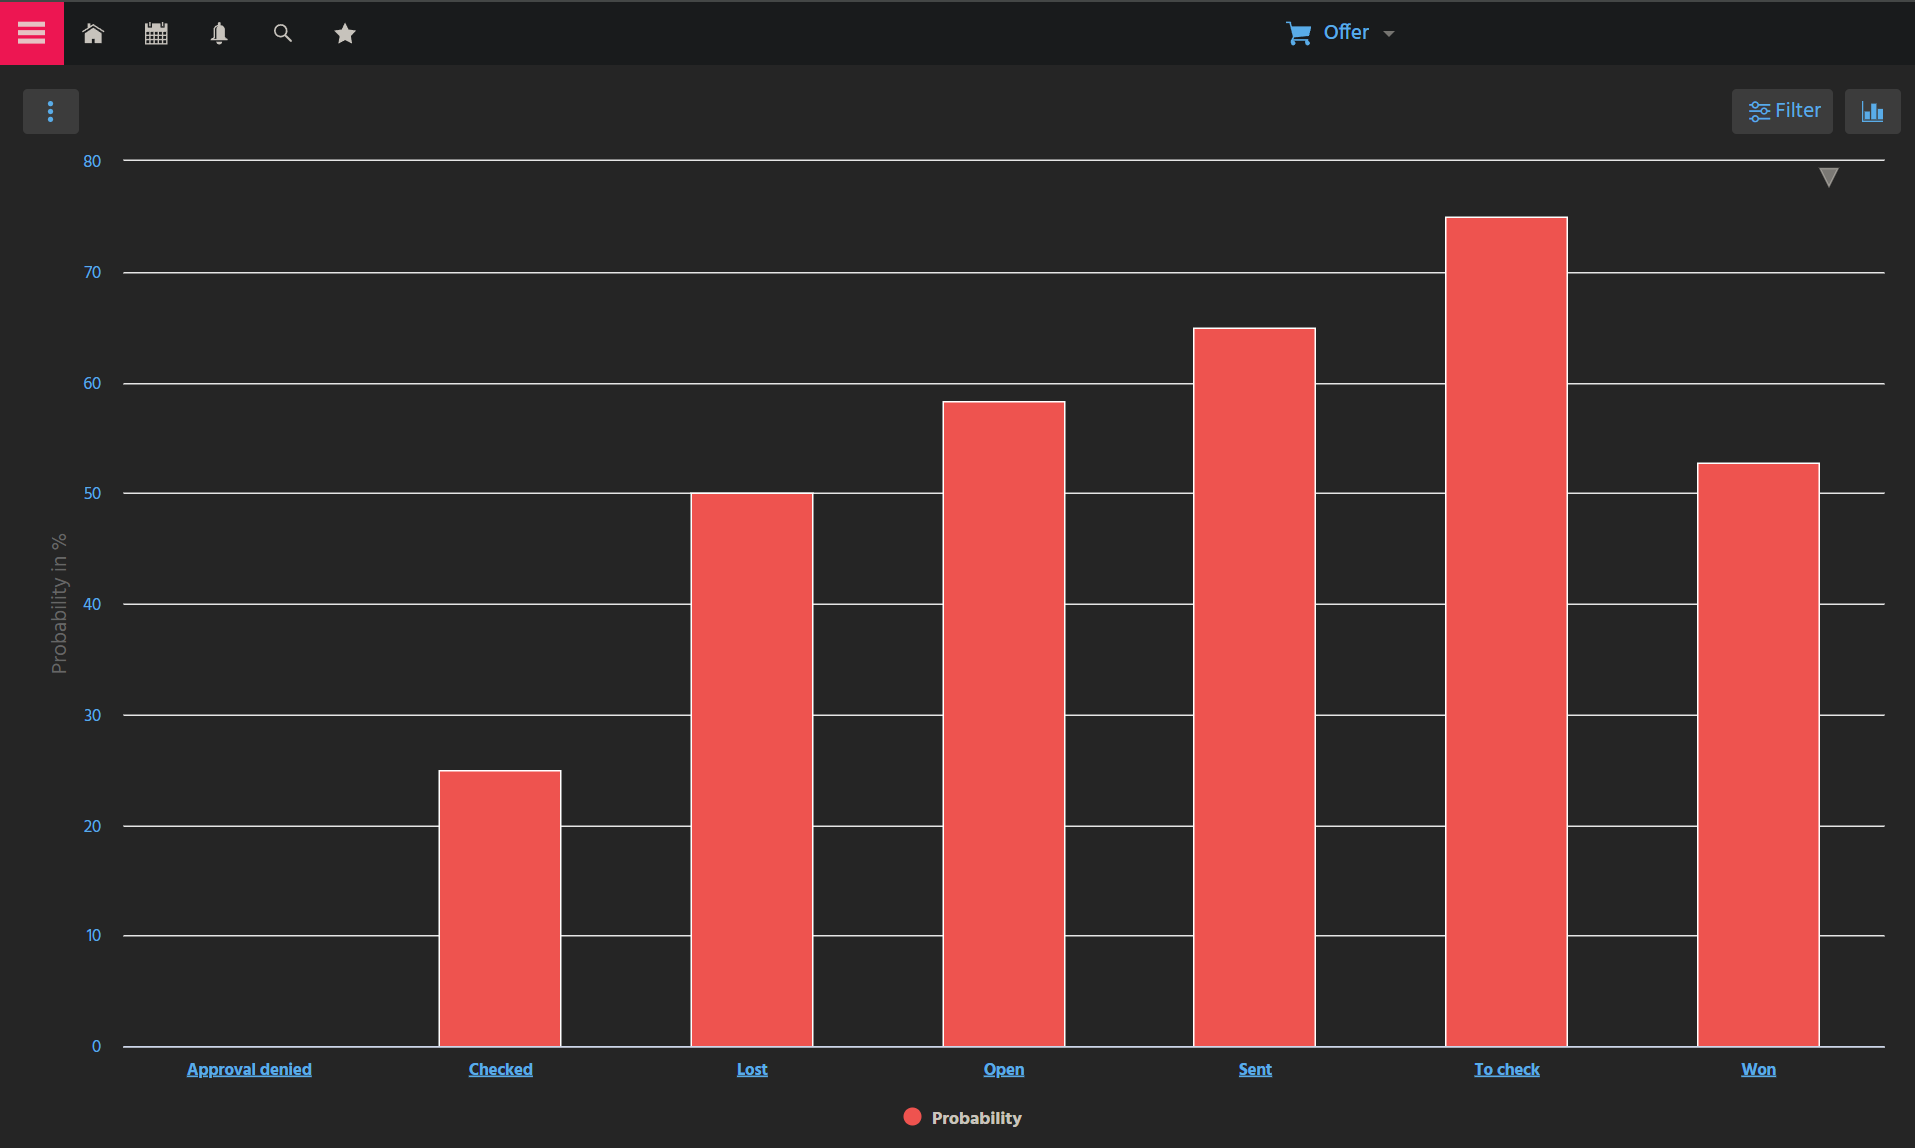
Figure: DynamicMultiDataChart showing grouped column chart for offer probabilities
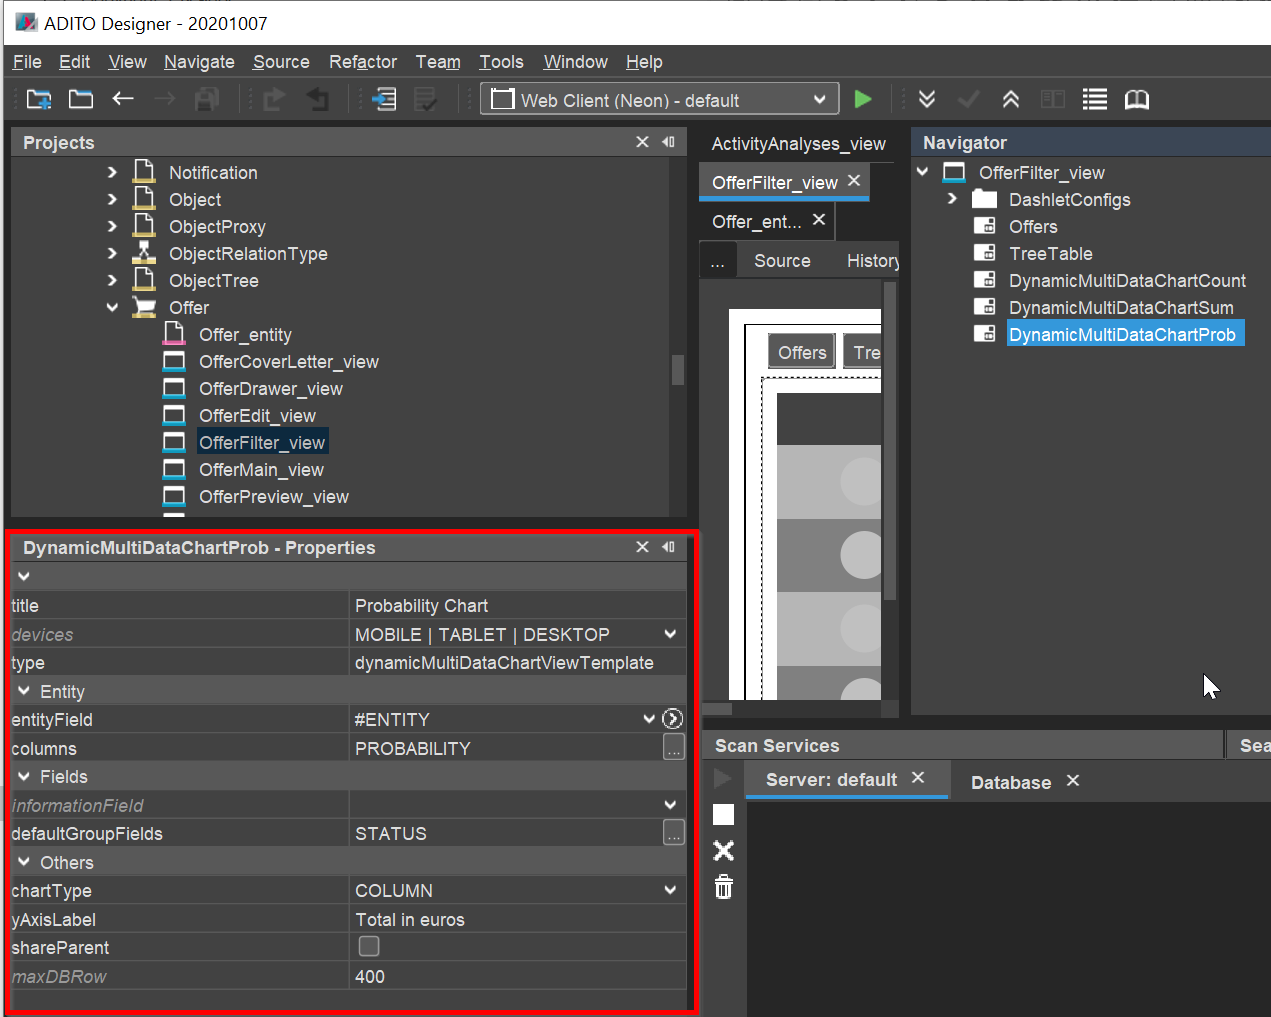
Figure: Configuration of DynamicMultiDataChart as shown above
Configuration
This ViewTemplate is intentionally minimalistic in setup and requires the following properties:
| Property | Description |
|---|---|
entityField | Defines the base dataset source used for chart generation. |
aggregateField | Indicates the numerical field to be aggregated for each group, such as status counts or revenue values. |
The remaining configuration is performed at runtime by the user. Users may choose:
- Grouping dimensions (e.g., offer status, responsible person)
- Chart type (if multiple visual styles are supported)
- Aggregation type (e.g., count, sum)
The DynamicMultiDataChart is well-suited for business dashboards where flexibility and end-user control over data representation are required. It enables users to explore data without technical configuration in the backend.