How to use
How to use telemetry with ADITO
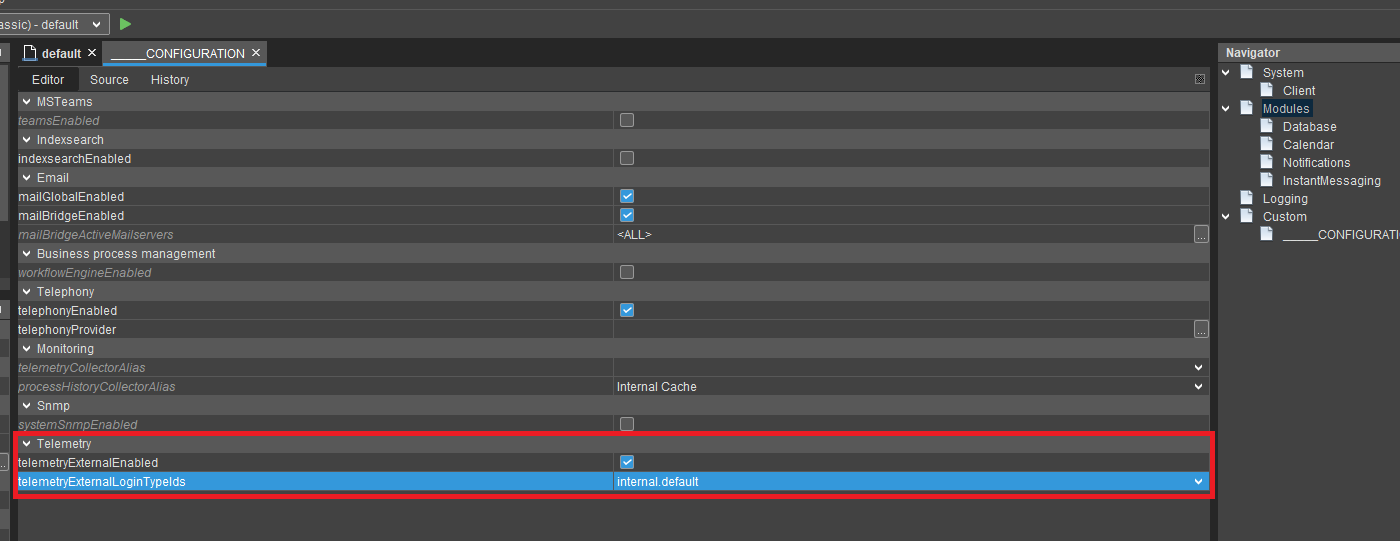
In order to enable ADITO to send telemetry data to external programs, you need to set a Setting in the instance configuration of your system. Therefore go to the ADITO Designer and open the project. Under system you can see all available systems your project has. Doubleclick on your system and open the _CONFIGURATION. On the left side go to "Modules" and at the bottom enable the property "telemetryExternalEnabled" and select a "telemetryExternalLoginTypeIds". The login types are defined in your project-"Preferences". You have to create a technical user in your system via the user-tab in your system.
This user has the following requirements:
-
Title = TelemetryUser
-
Password = (Config map entry "telemetry_pass" for SSP) or T (for onPremise projects)
-
Roles = INTERNAL_TECHNICAL, INTERNAL_WEBSEVICES
These values have to be the exact same!
If you are using Prometheus, it needs these credentials of the technical user to access the data. You can add this information in your "prometheus.yml".
basic_auth: username: 'YourTechnicalUser' password: 'YourPassword'
For local use you can see your current stats with e.g. Postman via a GET-request to https://localhost:8443/telemetry/ and the given credentials. These records refresh everytime you refresh the request. With JConsole you are able to do the same but with a UI. Open your installed JDK directory and open the bin folder (e.g. C:\Program Files\AdoptOpenJDK\jdk-15.0.1.9-hotspot\bin) and execute the "jconsole.exe". Now you can access the current instance of the ADITO Designer.
If you have a running prometheus service you can access the (local) service via http://localhost:9090/targets. You have to connect prometheus with the /telemetry/ URL in their settings.
If you want the raw values you can access this URL: https://localhost:8443/telemetry/?Authorization=Basic%20VGVsZW1ldHJ5VXNlcjpU.